Analytics-level
Analytics-level data quality focuses on understanding the ability of your data to support specific analyses and whether the results generated from those analyses are reasonable. This level of data quality assessment goes beyond the basic integrity checks performed at the atomic level and examines the data from an analytical perspective.
There are two main aspects of analytics-level data quality:
- Assessing which analyses your data can support
- Determining if the results your data generates for those analyses are reasonable
The analytics-level checks described below are intended to be used as a checklist. Each check exists as a data table in the Tuva Data Model, and the documentation below describes why the check is important and how to use these tables to perform the check.
Since many of the analytics-level checks involve assessing reasonableness, it's important to have something to compare to. For many of the checks we include reference data points based on Medicare FFS claims data. While not perfect for comparing to commercial and Medicaid populations, it still adds directional value (e.g. is a reasonable PMPM closer to $400 or $4,000).
We have organized most of the analytics data quality checks into two tables for ease of use.
The analytics reference summary table unions together the various analytics measures and their associated values in the Medicare FFS claims data set.
select *
from data_quality.analytics_reference_summary
order by analytics_concept
,analytics_measure
The analytics checks summary table unions together the different data quality checks and the count of results for each of those checks. Some of the checks are seen as "never events," meaning any result greater than zero is a problem worth looking into. Others are checks where results aren't a problem. The two different types of checks are separated with the "normally zero" in the data.
select *
from data_quality.analytics_checks_summary
where normally_zero = 1
order by result_count
Core Populated
The most basic check we perform at the analytics level is to confirm whether or not the Core Data Model is populated. Sometimes The Tuva Project builds all data tables in the data model, but because of data quality problems, a set of tables will end up with zero records (i.e., is not populated). This check gives us a quick glance at whether or not this is happening in the Core Data Model.
select *
from data_quality.core_populated
This query returns information about which tables in the Core Data Model are populated and which are not. If any tables are not populated, it may indicate upstream data quality issues that need to be addressed.
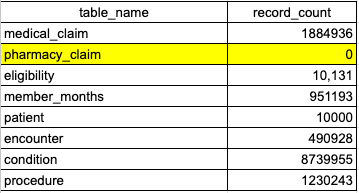
In the above image, core.pharmacy_claim has returned 0 rows, indicating that the table is not populated. In this example, the user should see the Pharmacy Claim section to help identify the root cause of why core.pharmacy_claim is not populated.
Analytics Populated
On top of the Core Data Model are the Data Marts. We use these Data Marts to perform analytics. However, sometimes the tables are not populated because of data quality issues. This table lets us see if this is happening at a glance.
select *
from data_quality.analytics_populated
This query provides information about which Data Mart tables are populated. If any tables are not populated, it may indicate issues with the data transformation process or upstream data quality problems.
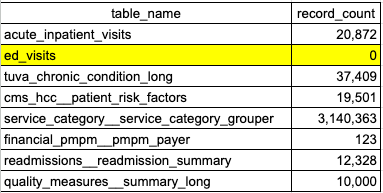
In the above image, ed_visits has returned 0 rows, indicating there is an issue with one of the fields used to create ED encounters or service categories. In this example, the user should go to the Claim Line Fields section to help identify the root cause of why ed_visits is not populated.
Chronic Conditions
Chronic diseases follow a very predictable distribution in patient populations. Here we check the prevalence of the top 10 chronic conditions in Medicare FFS data and compare it to the prevalence in your data.
select *
from data_quality.chronic_conditions_prevalence
This query returns the prevalence rates of common chronic conditions in your population, along with benchmark comparisons. Significant deviations from expected prevalence rates may indicate issues with diagnosis coding or population differences that need to be understood.
select *
from data_quality.chronic_conditions_none
The above query returns the percent of patients who have no chronic conditions, along with benchmark comparisons from the Medicare data. A significantly higher or lower number of members without chronic conditions may indicate issues with diagnosis coding or population differences that need to be understood. For example, commercial populations may have a higher percentage of members without chronic conditions due a generally younger and healthier group of enrollees.
To confirm if an unexpected result is due to data quality issues with diagnosis codes, the user should reference the Diagnosis and Procedure Fields section of the atomic-level checks.
Encounter Types and Service Categories
Encounter types and service categories provide insight into the distribution of healthcare services across different types of care. This section examines the utilization rates, costs, and trends associated with various encounter types and service categories. Understanding these patterns helps identify potential areas of concern or opportunity in healthcare delivery.
select *
from data_quality.encounters_missing_groups
This query returns information about encounter groups that are missing in the dataset. This is a high level check to ensure that all encounter groups are present in the data. If any encounter groups are missing, it may indicate issues with data mapping that needs to be addressed. The underlying issue could be in one of the following sections: Diagnosis and Procedure Fields, Institutional Header Fields, or Claim Line Fields.
select *
from data_quality.encounters_cost_and_utilization_trend
order by year_month
The above query provides trend data for encounter costs per unit and utilization (as PKPYs) over time. This information is valuable for identifying patterns in healthcare service delivery and costs, which can inform resource allocation and policy decisions. Additionally, we can ensure consistent trends across time periods and quickly identify potential data quality issues if data is suddenly missing. For example, if we ran this query:
select *
from data_quality.encounters_cost_and_utilization_trend
where encounter_type = 'acute inpatient'
order by year_month
With these results:
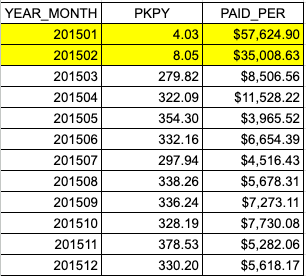
We can see that we have paid amounts for acute inpatient encounters in January and February (shown as very high paid per values for those months) but low volume (PKPY). This is a clear indication of a data quality issue as the values are significantly different for the rest of the year. In this case, the user should go to the Institutional Header Fields section of atomic-level data-quality to help identify the root cause of why acute inpatient encounters are not populated in the first two months.
select *
from data_quality.encounters_cost_and_utilization
This query returns paid per encounter and PKPY data for different encounter types. Analyzing this information helps in understanding the distribution of healthcare resources across various service categories and can highlight areas of high cost or utilization that may require further investigation.
If we ran the following query to specifically examine acute inpatient PKPY and cost pers relative to the Medicare data:
select *
from data_quality.encounters_cost_and_utilization
where analytics_measure = 'acute inpatient'
And got the following results:

It would raise some questions about the underlying dataset and potentially identify a data quality issue. For example, in the image above we see that the PKPY values are very similar (263.32 vs 258.68). However, the paid per encounter is less than half in our dataset ($7,998) vs ($16,134).
In order to better determine if this is true or the result of a data quality issue, it is important to take into account the other information we know about the dataset. Is it Medicare data? Commercial data? What is the age distribution of the population? What are their risk scores? What are the types of hospital procedures that are being performed? The answers to these questions can help us better understand the context of the data and potentially identify a data quality issue.
select *
from data_quality.service_category_pmpm_trend
The query above shows the trend of per member per month (PMPM) costs for different service categories over time. This data is crucial for tracking changes in healthcare spending patterns and identifying potential cost drivers or areas for cost containment. Comparing this to industry benchmarks or historical data can give insights into overall cost trends and the efficiency of healthcare delivery in your population.
Financial PMPM
Per Member Per Month (PMPM) costs are a key metric in healthcare analytics. As the previous sections examined PMPM at the service category and encounter levels, this section evaluates overall PMPM costs. This can be useful in identifying any high level issues with claim type mapping, or missing claims in general.
select *
from data_quality.data_quality_financial_pmpm
order by year_nbr
A typical PMPM (Per Member Per Month) for various populations are outlined in the table below:
| Payer Type | PMPM Range |
|---|---|
| Commercial | $300-$500 |
| Medicare/Medicare Advantage | $800-$1200 |
| Medicaid | $200-$400 |
There are always exceptions to these rules, specifically if a population is higher risk than average for the payer type.
A typical split based on claim type is listed below:
| Claim Type | Percent of Total Spend |
|---|---|
| Institutional | 50% - 80% |
| Professional | 20% - 40% |
| Pharmacy (if applicable) | 10% - 30% |
The claims data split by claim type can be viewed at the table here:
select *
from data_quality.data_quality_claim_percent
order by percent_of_total_paid
If spend falls outside of these ranges, it could indicate a mapping or data quality issue.
Atomic Checks The following atomic checks would be a good place to check for data quality issues if the analytics check surface any potential issues
- place of service code
- bill_type_code
- revenue center code
- ms_drg_code
ED Visits
ED visit analysis is one of the most common types of analysis. The ED visit PKPY rate is covered under the encounter and service category sections. Here we specifically look at whether the distribution of ED Visits by preventable classification is reasonable and if each of the important categories are populated
In this table we check to make sure each of the avoidable or non avoidable categories of emergency department use are populated. If one or more of the sections is missing in the data, a 1 would appear in the result_count column. This would likely indicate an issue with diagnosis code mapping as the classification algorithm is diagnosis code based.
select *
from data_quality.data_quality_ed_classification
In the table below, we verify that each category of avoidable or non-avoidable emergency department use is populated. If one or more sections are missing from the data, a 1 will appear in the result_count column. This likely indicates an issue with diagnosis code mapping, as the classification algorithm is based on diagnosis codes.
select *
from data_quality.data_quality_ed_classification_reference
Atomic Checks The following atomic checks would be a good place to check for data quality issues if the analytics check surface any potential issues
- icd_diagnosis_code
- bill_type_code
Acute Inpatient Visits
Acute Inpatient Visits represent a significant portion of healthcare costs and serve as an important indicator of population health. This section analyzes various aspects of inpatient care, including visit rates, length of stay (ALOS), costs, mortality rates, and case mix complexity. These metrics provide insights into the intensity and quality of inpatient care delivery.
- ALOS (Average Length of Stay)
- Average Mortality Rate
- Top DRGs (Diagnosis-Related Groups)
The following table checks whether any acute inpatient encounters lack associated professional claims. Professional claims are matched with institutional claims as part of the encounter-building process. If no professional claims can be matched (based on claim dates and patient ID) to institutional claims, these cases will be flagged here.
select *
from data_quality.data_quality_acute_inpatient
This table measures the average length of stay and mortality rate of inpatient encounters, comparing them to the Medicare FFS (Fee-for-Service) claims data. If there is a variance of ±2 days in the length of stay, it warrants further investigation to understand the cause. The mortality rate may vary depending on the population type.
select *
from data_quality.data_quality_acute_inpatient_reference
This table measures the prevalence of the top 10 DRGs in the data and compares their prevalence to the top 10 DRGs in Medicare data. If the most common DRGs from Medicare are not found in the data source, it could indicate a data issue. Alternatively, it could reflect differences in the population compared to the Medicare population.
select *
from data_quality.data_quality_acute_inpatient_prevalence
Atomic Checks The following atomic checks would be a good place to check for data quality issues if the analytics check surface any potential issues
- icd_diagnosis_code
- ms_drg_code
- bill_type_code
- claim_line_start_date
- claim_line_end_date
- claim_start_date
- claim_end_date
- admit_date
- discharge_date
Readmissions
Readmission rates are a key quality indicator in healthcare. This section focuses on 30-day readmission rates, both overall and for specific diagnoses. Understanding readmission patterns can help identify opportunities for improving care transitions and reducing unnecessary hospitalizations.
- 30-day readmission rate
The following table checks for various reasons why inpatient encounters were not eligible to be considered as index admissions (and were therefore excluded from the readmissions calculation). Some degree of encounters with data quality issues is unavoidable in claims data, but if the number of excluded encounters exceeds a few percentage points of the total, it is worth investigating further.
select *
from data_quality.data_quality_readmissions
This table compares the readmission rate in the data source to the readmission rate from the Medicare FFS (Fee-for-Service) claims data. Normal variation in readmission rates is between 5% and 20%. Any rates outside of this range are unusually high or low and should be researched further.
select *
from data_quality.data_quality_readmissions_reference
Atomic Checks The following atomic checks would be a good place to check for data quality issues if the analytics check surface any potential issues
- icd_diagnosis_code
- ms_drg_code
- bill_type_code
- admit_date
- discharge_date
CMS-HCCs
The CMS Hierarchical Condition Category (HCC) risk adjustment model is widely used to predict healthcare costs. This section analyzes risk scores, comorbidity rates, and trends in risk scores over time. These analyses provide insight into the health status of the population and its predicted resource utilization.
This table checks whether both demographic factors and disease factors are present in the CMS-HCC mart. Issues with enrollment or diagnosis codes may cause one or both factors to be missing. A result count of 1 indicates that the factor was missing from the data.
select *
from data_quality.data_quality_cms_hcc
This table compares the average CMS HCC score in the data source to the average score from Medicare FFS (Fee-for-Service) claims data. The expected score for Medicare populations is typically around 1. If there is significant deviation from 1 (< 0.7 or > 1.5), it could indicate a problem with the data. However, if the population is known to be particularly healthy or very sick, this variance might be expected.
For commercial and Medicaid populations, the risk score cannot be directly compared, as the CMS-HCC risk adjustment algorithm was specifically trained on Medicare populations and their unique conditions.
select *
from data_quality.data_quality_cms_hcc_reference
Atomic Checks The following atomic checks would be a good place to check for data quality issues if the analytics check surface any potential issues:
- icd_diagnosis_code
- enrollment_start_date
- enrollment_end_Date
- sex
- birth_date
Quality Measures
Quality measures are essential for assessing the effectiveness and efficiency of healthcare delivery. This section examines various quality measure rates, their trends over time, and gaps in care. These analyses provide insights into the quality of care being delivered and highlight areas for potential improvement.
select *
from data_quality.data_quality_quality_measures
In this query, we check whether the numerator or denominator for any quality measure is 0. While it is possible for a population to have a 0 in either category, it is unlikely. Therefore, we flag the number of quality measures where this occurs and recommend investigating the possible reasons to determine if such results are plausible.
select *
from data_quality.data_quality_quality_measures_reference
In this query, we compare the percentage of each measure (numerator/denominator) against the Medicare FFS (Fee-for-Service) claims data set. This comparison helps assess the reasonableness of the values for each measure. Some measures may naturally have very low percentages, while others may have very high percentages. If your data shows results that are drastically different, it could indicate a potential data quality issue.
Atomic Checks The following atomic checks would be a good place to check for data quality issues if the analytics check surface any potential issues:
- icd_diagnosis_code
- enrollment_start_date
- enrollment_end_Date
- sex
- birth_date
- hcpcs_code
- icd_procedure_code