Dashboards
Dashboards run automatically on top of the Core Data Model and Data Marts. The dashboards below are hosted by Tuva and run on synthetic datasets. The code for these dashboards can be found here.
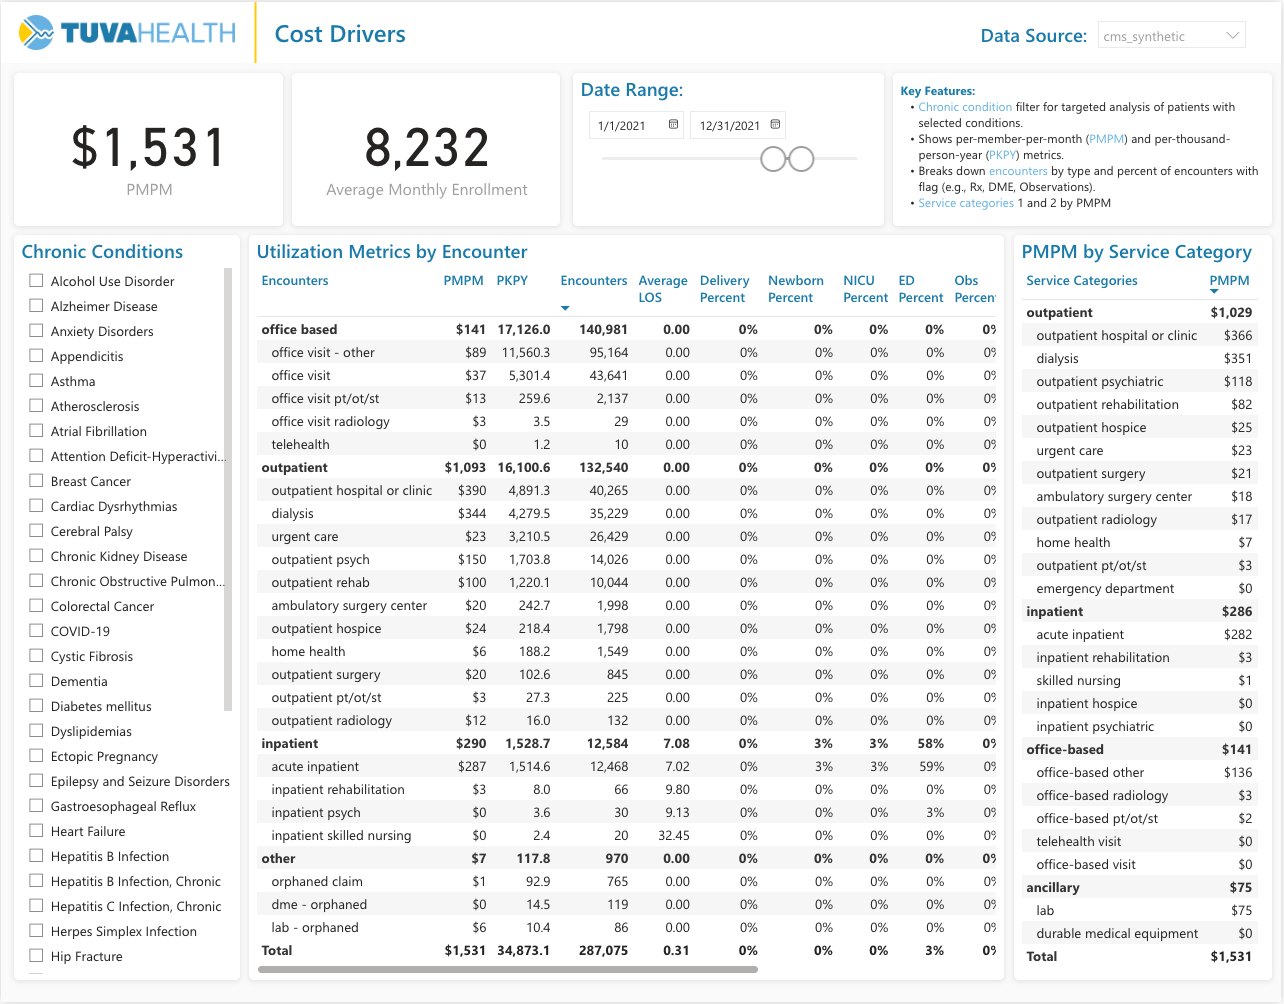
Cost & Utilization Drivers
This dashboard demonstrates how you can use the Tuva service category, encounter, and condition groupers to drill into claims data to identify opportunities for improvement.
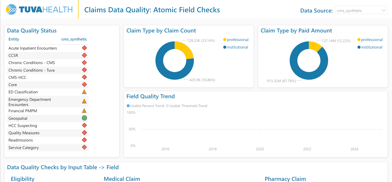
Data Quality
This dashboard demonstrates how you can use the Tuva data quality tables to profile and identify atomic-level data quality issues in raw claims data.
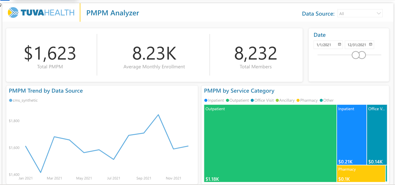
Population Insights
This dashboard demonstrates how several data marts from Tuva can be used to profile your patient population looking at demographics, chronic disease burden, spend, utilization, and acute events.
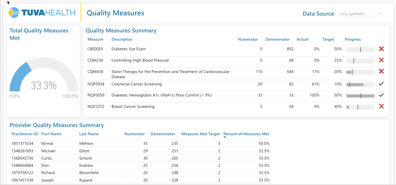
Quality Measures
This dashboard demonstrates how you can use the quality measures data mart to analyze clinical quality measures and care gaps.
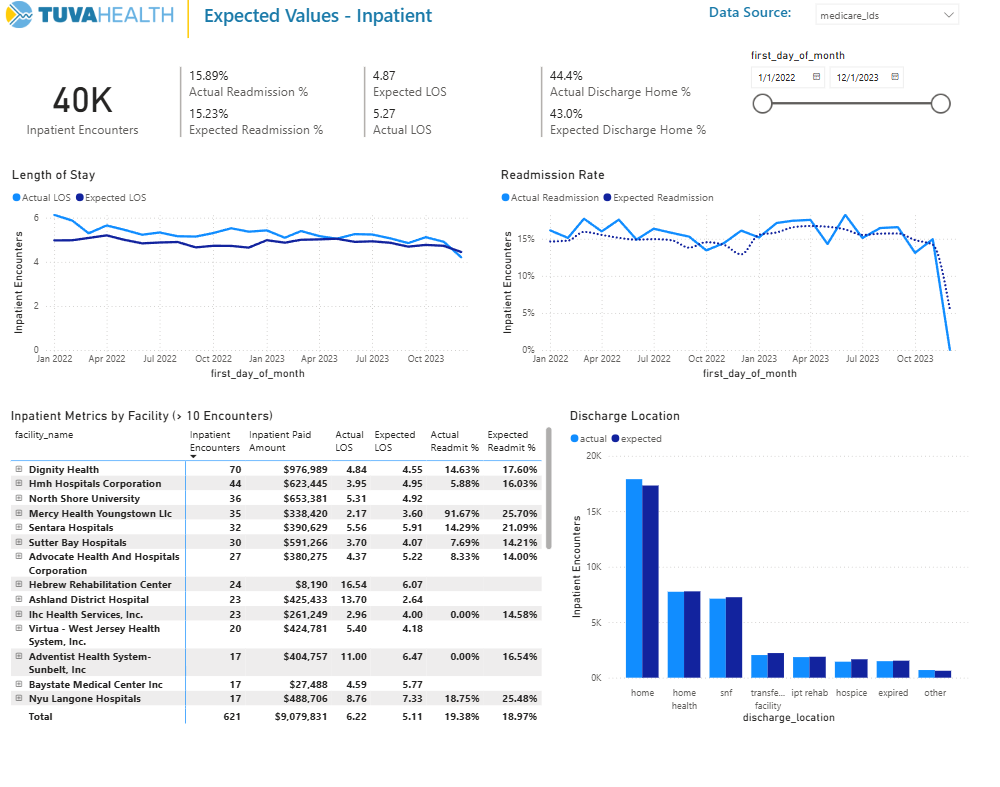
Risk-adjusted Benchmarks
This dashboard shows the expected values produced by the benchmarking mart and compares them to actual values for analysis.