4. Quality Measures
Quality measures help us measure or quantify healthcare processes, outcomes, patient perceptions, organizational structure, and systems. These measures are related to one or more quality goals for health care (e.g., effective, safe, efficient, patient-centered, equitable, and timely care). CMS uses quality measures in its quality improvement, public reporting, and pay-for-reporting programs for specific healthcare providers.
However, value-based care has become synonymous with long lists of quality measures that healthcare providers must track and many overlapping programs and measure definitions. CMS has launched new “simplified” reporting programs to help address these administrative burdens, such as the Alternative Payment Model Performance Pathway (APP) and ACO REACH.
Quality measures are typically developed based on research and clinical practice evidence. Measures are developed by:
- Public agencies (e.g., CMS and the Agency for Healthcare Research and Quality)
- Private nonprofits (e.g., the National Committee for Quality Assurance)
- Professional medical associations
- Private groups
Components of a Quality Measure
Quality measures have many standard sections:
- Measure ID: Measures can have several different identifiers. These are created by the measure steward (i.e., the organization that authored and maintains the measure). For example, the identifiers for Breast Cancer Screening are NQF 2372, MIPS CQM Quality ID #112, and eCQM CMS125.
- Measure Description: A brief description of the purpose of the measure.
- Denominator: The population to which the measure applies (i.e., the number of people who should have received a service or action such as a screening). The denominator is the lower part of a fraction used to calculate a rate.
- Numerator: The portion of the denominator population that received the service or action for which the measure is quantifying. The numerator is the upper part of a fraction used to calculate a rate.
- Exclusions/Exceptions: An exclusion is a reason that removes a patient from both the numerator and denominator because the measure would not appropriately apply to them. Exceptions are due to medical reasons (e.g., patient is comatose), patient reasons (e.g., patient refuses), and system reasons (e.g., shortage of a vaccine).
- Measure Period: The timeframe in which the service or action should have occurred.
- Value Sets: The healthcare codes used to define the clinical concepts used in the measure. These codes are from standard systems such as ICD-10, CPT, LOINC, RxNorm, SNOMED, etc.
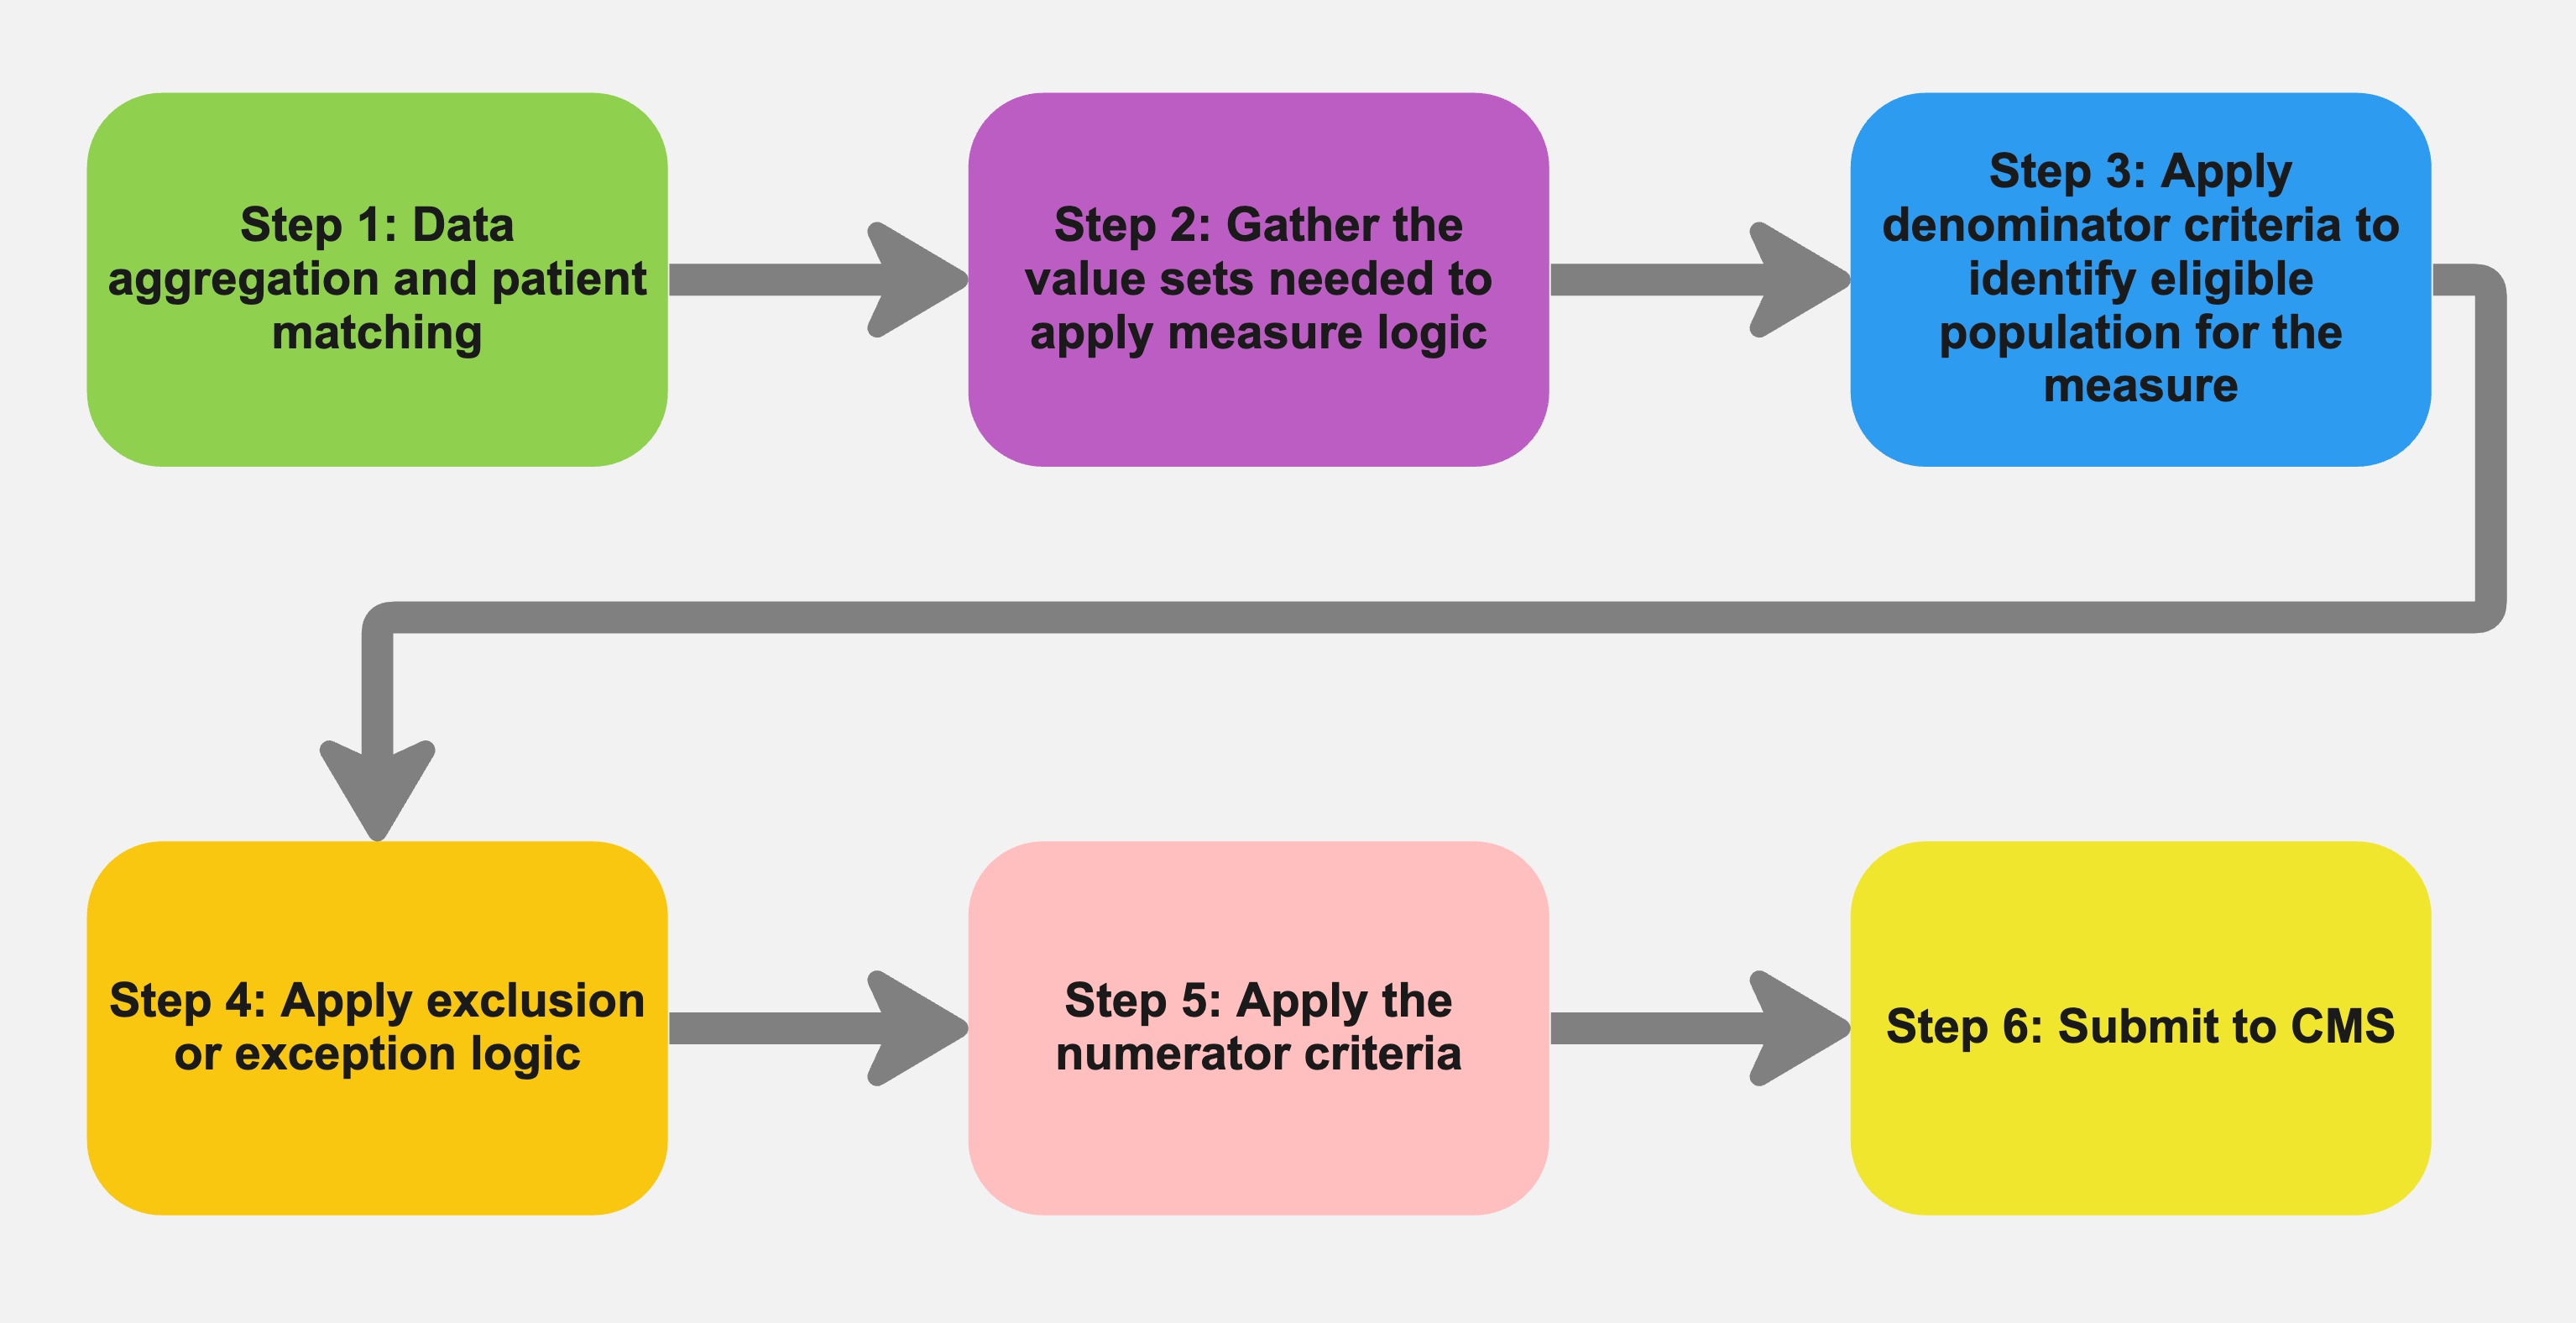
Methodology
Below is a simplified flow chart for calculating a quality measure.
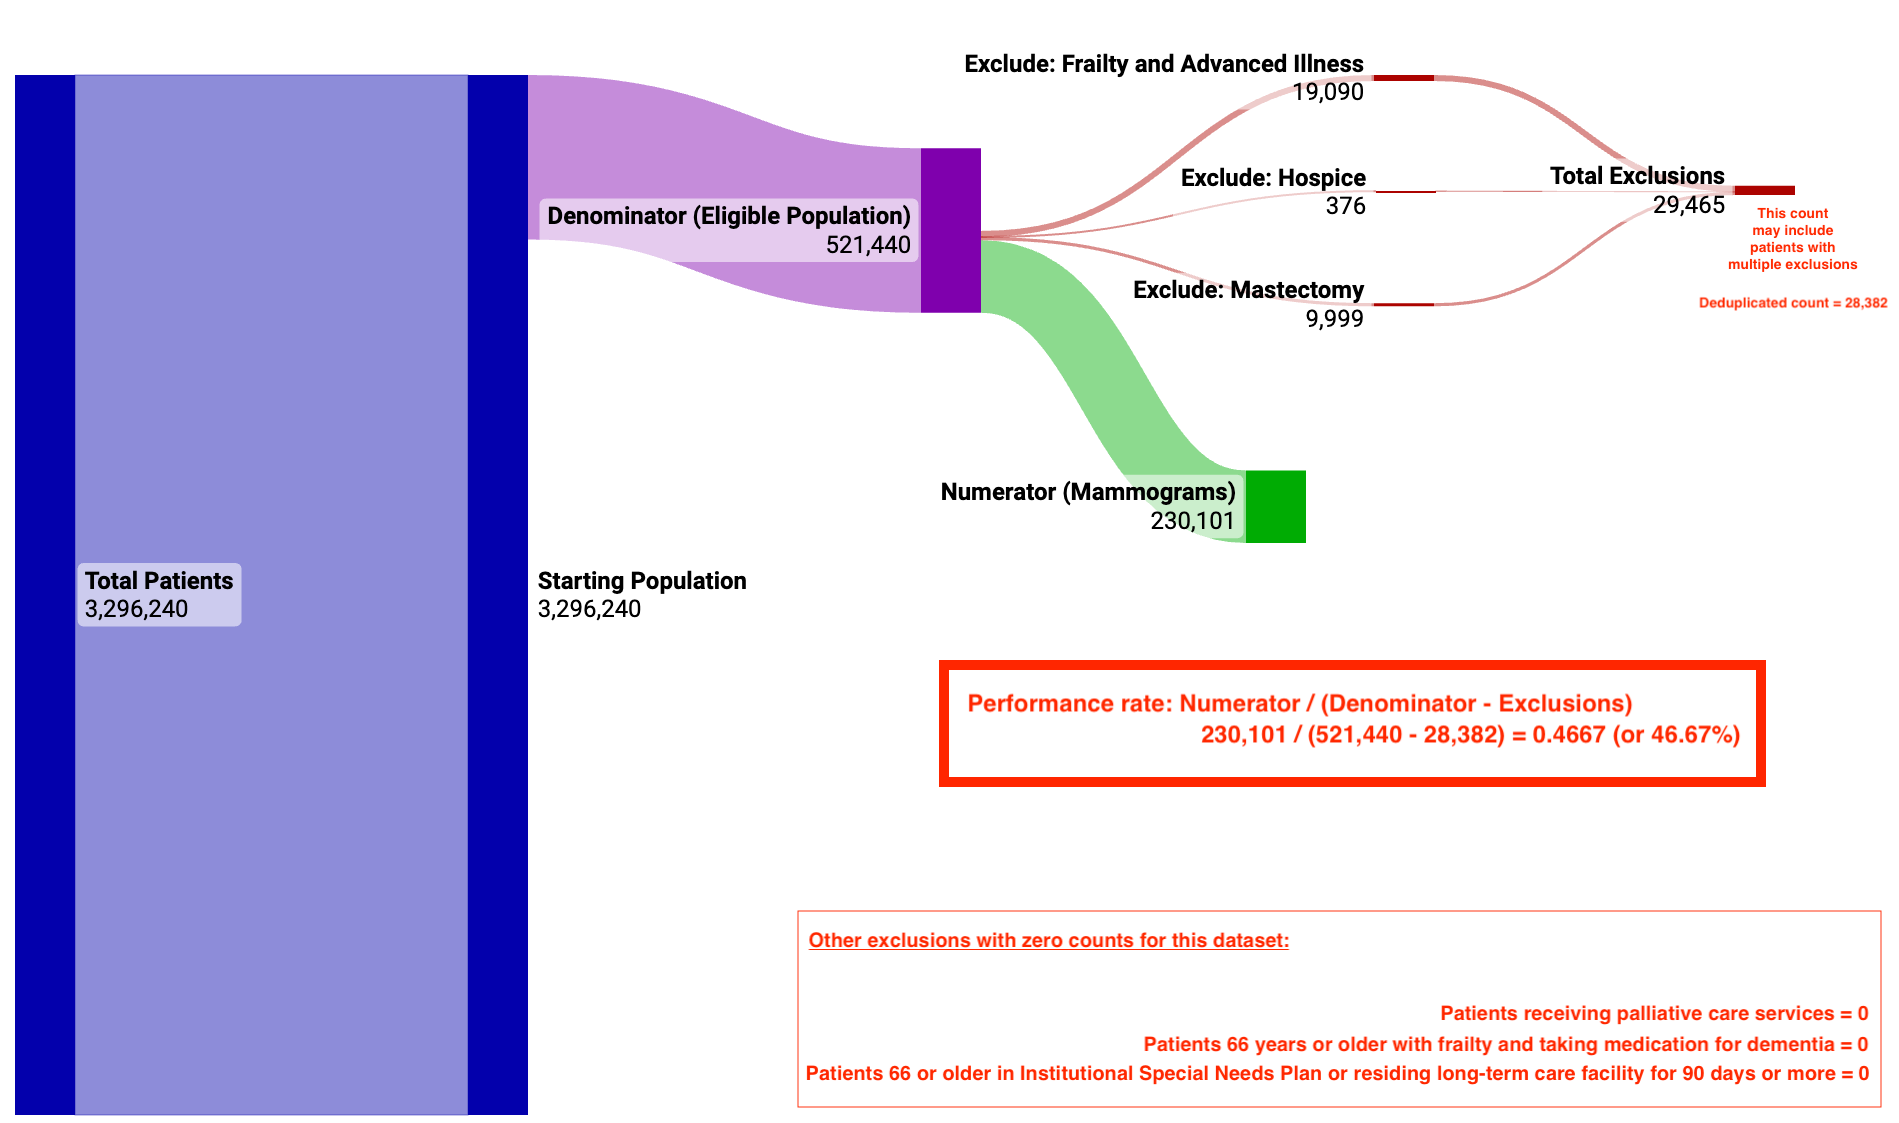
Below is an example of the concepts and logic in the Breast Cancer Screening quality measure using the Medicare LDS 5% data set.
Quality Measures Data Mart
See it on GitHub.
The Quality Measure data mart is a growing catalog of Clinical Quality Measures (CQMs). This mart provides structure to support many measures with overlapping value sets and logic. You need only to map your data to the Claims and Clinical Data Models and run the Tuva Project.
Data Requirements
Condition:
- patient_id
- claim_id
- recorded_date
- source_code_type
- source_code
- normalized_code_type
- normalized_code
Encounter:
- patient_id
- encounter_type
- encounter_start_date
- encounter_end_date
Medication:
- patient_id
- dispensing_date
- source_code_type
- source_code
- ndc_code
- rxnorm_code
Observation:
- patient_id
- observation_date
- source_code_type
- source_code
- normalized_code_type
- normalized_code
Patient:
- patient_id
- sex
- birth_date
- death_date
Procedure:
- patient_id
- procedure_date
- source_code_type
- source_code
- normalized_code_type
- normalized_code
Medical Claim:
- patient_id
- claim_id
- claim_start_date
- claim_end_date
- place_of_service_code
- hcpcs_code
Pharmacy Claim:
- patient_id
- dispensing_date
- ndc_code
- paid_date
Note: The Tuva Project will generate these Core tables. You just need to map your data to the Claims or Clinical Data Models and run the project.
Variables
The data mart has one variable that allows you to choose a measurement period end date. This variable can run older performance periods or a calendar year-end. The default is the current date.
quality_measures_period_end
Data Mart Structure
Staging
The staging tables show what tables and fields are used from the Core data model.
Intermediate
The intermediate tables contain the complex logic for each quality measure. The models are organized by denominator, numerator, and the various exclusions.
Final
The final tables are an aggregated view of all quality measures and your population.
- Summary Counts: Reporting measure counts with performance rates.
- Summary Long: Long view of the results for the reporting version of all measures. Each row represents the results a measure per patient. A null for the denominator indicates that the patient was not eligible for that measure.
- Summary Wide: Wide view of the results for the reporting version of all measures. This model pivots measures on the patient level (i.e. one row per patient with flags for each measure. The false flags can be treated as care gaps as exclusions have been included in the pivot logic.
Data Quality Issues
Many organizations that have the technical staff needed to build the logic for a quality measure may still run into data quality issues. Some common data quality issues are listed below.
- Aggregating and deduplicating data sources.
- Matching patients across these various data sources.
- Missing data or not having enough data:
- Missing key data points required for the measure, such as date or birth or gender.
- Missing types of data, such as labs or medications.
- Some measures may go back several years for screening data, such as Colorectal Cancer Screening).
- Some measures may require other data sources, such as labs or survey data, that are not easy to obtain or work with.
- Merging claims into encounters to accurately look for institutional stays or residing in a long-term care facility for more than 90 days during the performance period.
- Normalizing healthcare codes to the value set required by the measure.
- Mapping custom data from an EMR, such as observations and report or document tags, to a proper code from the measure value set.
Introduction Video
In this video, we walk through the high-level concepts of the Breast Cancer Screening quality measure and common data quality issues that may come up when calculating a measure.